Commit-response study of the public Forgejo repository
neuwirth/levineuwirth.org, October 1 to October 19, 2026
(UTC). Prepared 2026-10-20. All times are UTC.
Short answer
We found no convincing evidence of repeated, prompt fetching
after pushes. The dominant user-agent cohort mostly revisited
older commits and made no commit-specific GET within an hour of
publication. That argues against a crawler that promptly fetched every
new commit. It leaves intermittent or otherwise unobserved monitoring
unresolved.
The planned timing test is null. The more direct evidence is what was
fetched, and when.
Planned test: no detected prompt increase. It
compared successful GETs in the 30 minutes after each push with the 30
minutes before, over 40 episodes.
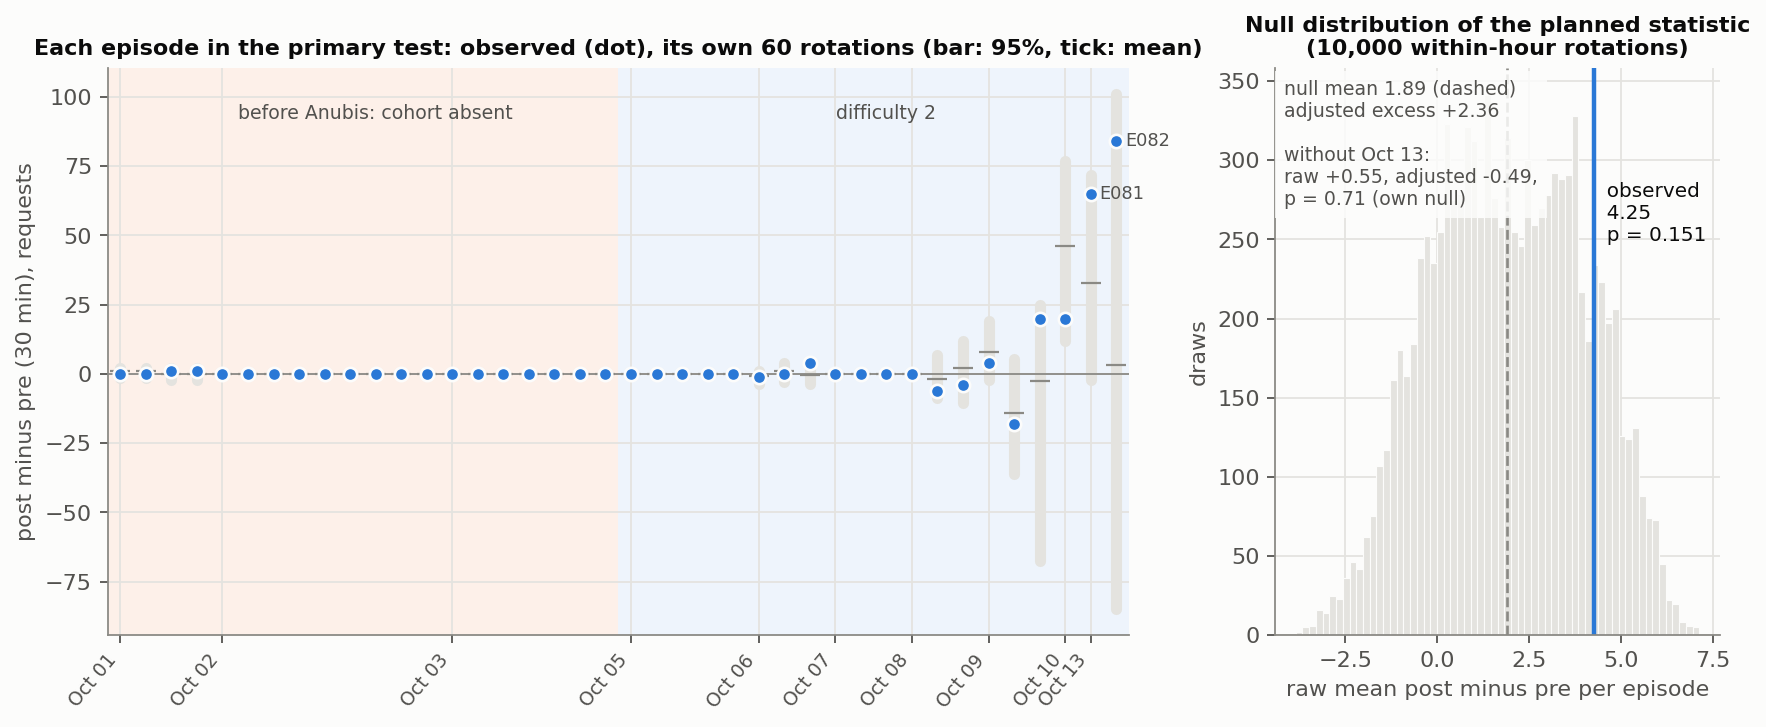
The raw mean difference was +4.25 requests per episode (829 after,
659 before).
Shuffling push times within their hours already produces +1.89 on
average, so the rotation-adjusted excess is +2.36 (p =
0.151).
Resampling overlapping-window clusters gives a 95% interval for the
adjusted excess of −1.47 to +7.75. Resampling whole dates gives −1.97 to
+10.47. Neither dependence model is established, and only 10 dates
exist.
Oct 13 alone produces the excess. Without it, raw +0.55 and adjusted
−0.49 (p = 0.71). Its extra requests went to commits more than a week
old, not to the new ones.
Detection is conditional on the injection model.
Planting 10 extra requests in the 10 minutes after every
push was detected in 300 of 300 simulations. That model includes days
when the cohort was almost absent.
Restricted to the 20 difficulty-2 episodes, the same response is
detected 68% of the time. On the 15 episodes when the cohort was active
(Oct 6–13), it is detected 52% of the time, and +20 requests 96%.
These simulations measure added request volume, not hash-specific
behavior or every way a monitor could work.
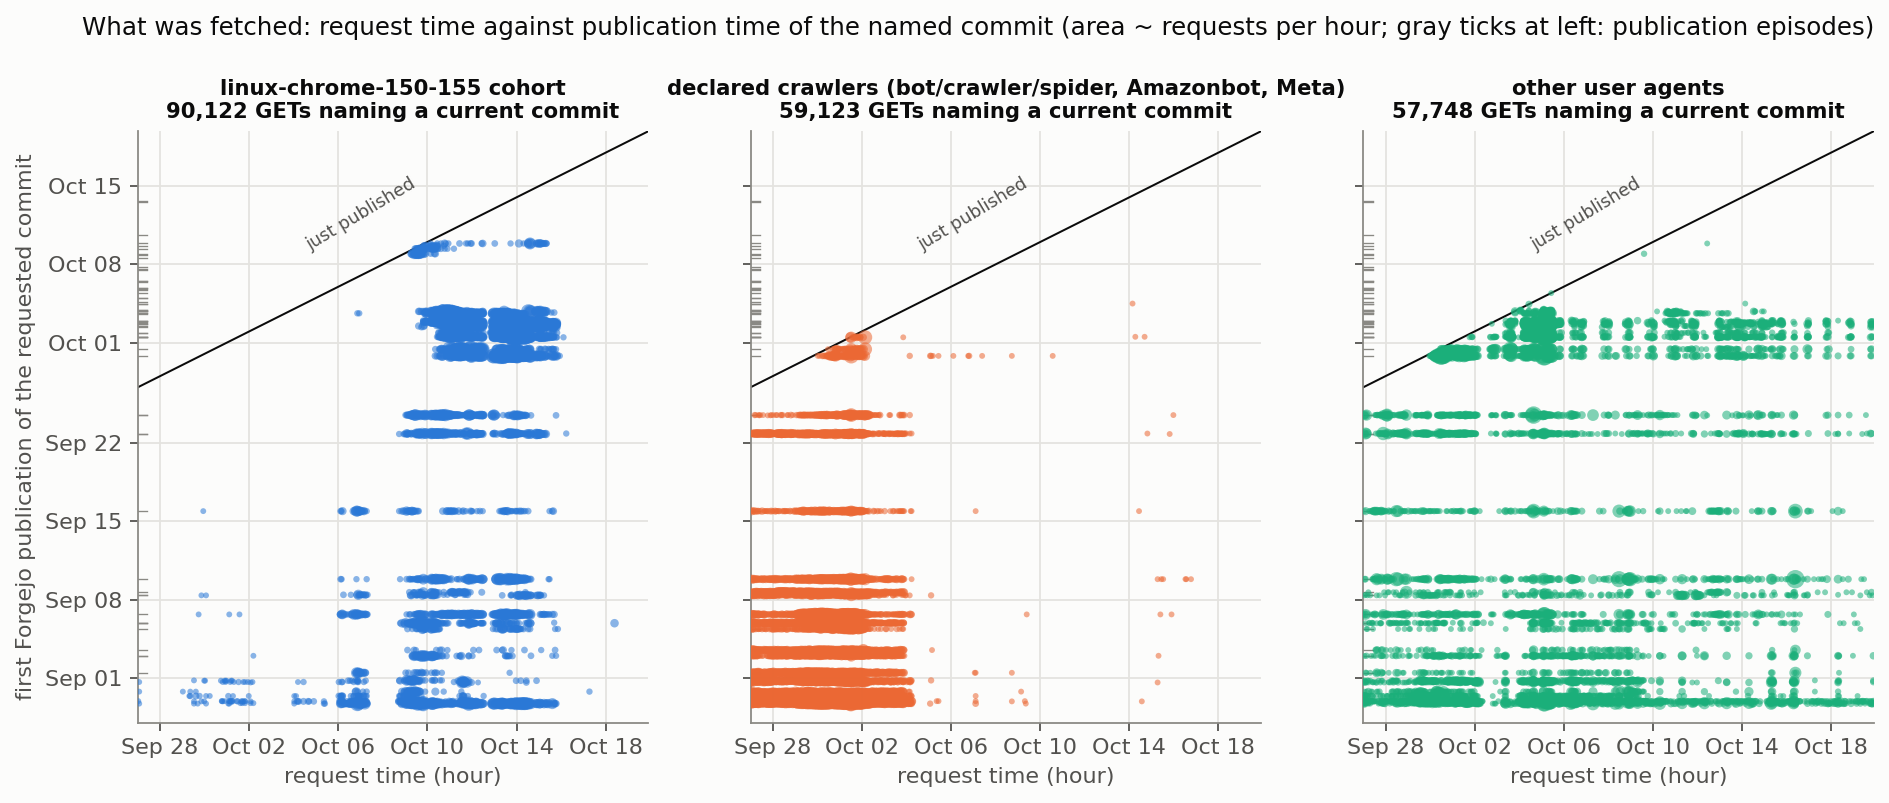
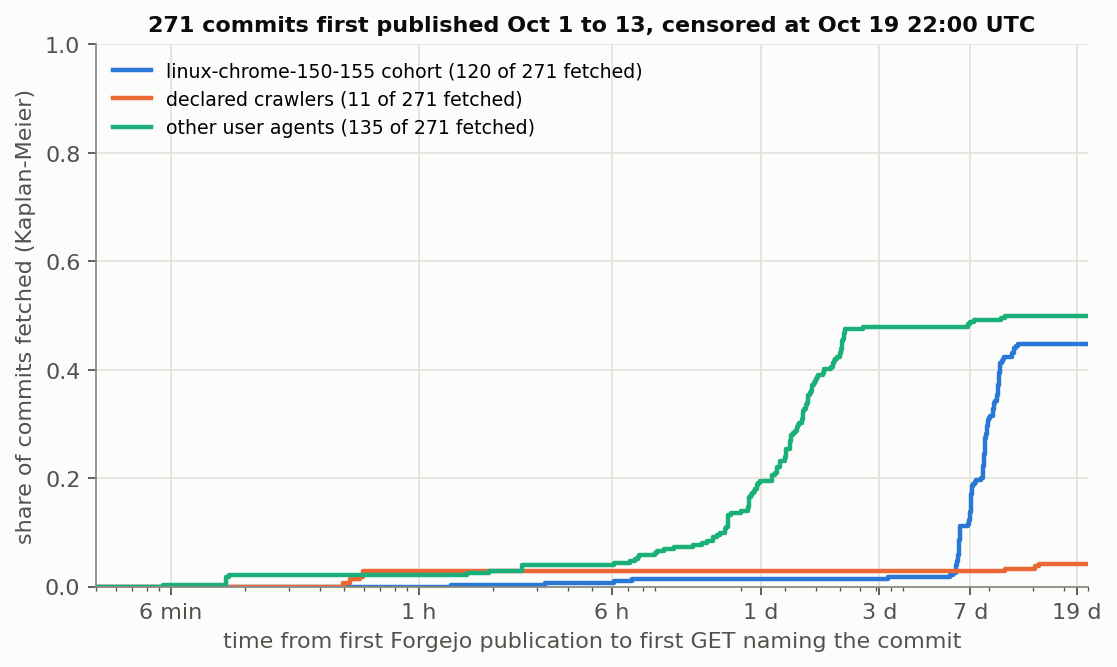
The dominant cohort made no commit-specific GET within an
hour of publication. This is the
linux-chrome-150-155 user-agent cohort.
It made 90,122 GETs naming a current commit. The youngest target was
1.35 hours old at the start of its request minute.
36 targeted commits 1 to 6 hours old. 87,270 targeted commits more
than 7 days old by the minute midpoint; 87,265 are older even at the
start of their minute.
Per available commit-hour, it requested commits over 7 days old
about 7 times as often as commits 6 to 24 hours old.
Apart from four later branch tips, its crawl covered commits
published by Oct 3 ~19:00, which it reached 3 to 10 days late.
It never requested anything published Oct 3 20:05 to Oct 8 19:36, or
anything after Oct 9 20:53, through Oct 19.
Its only young fetches were the branch tips of four Oct 8–9 pushes,
1.3 to ~24 hours later. They came on the one day it crawled branch
views, which display the current tip. That timing is consistent with
link traversal; the logs cannot identify the mechanism.
Fast fetches were rare and did not repeat. Requests
naming a commit within 60 minutes of its publication came in 4 of 48
study episodes (3 of 43 excluding the Anubis deployment day, which holds
E058).
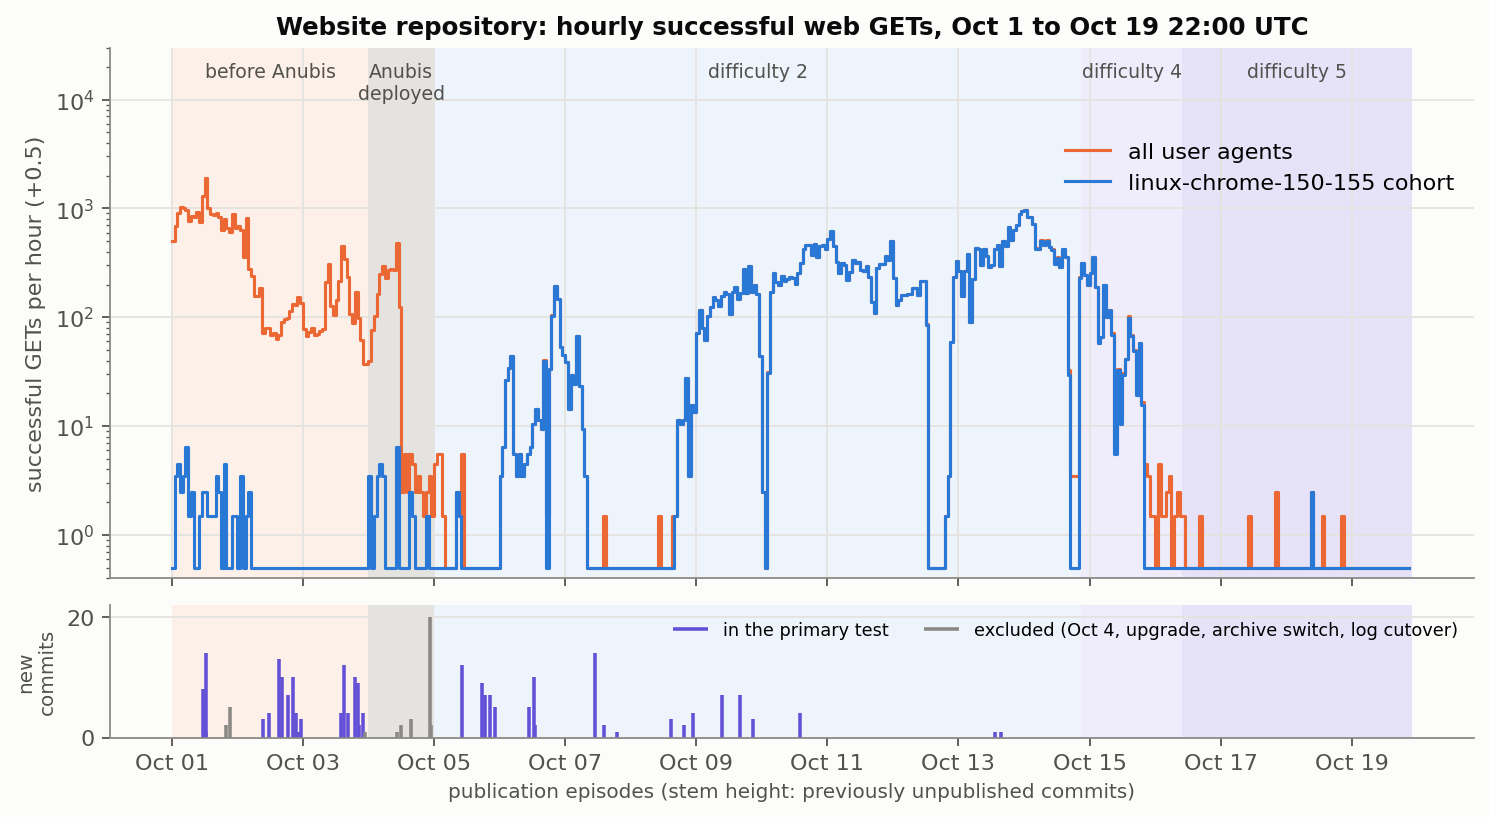
Oct 1: a declared crawler was already crawling the repository at
about 9 GETs a minute. Twenty minutes after the 11:19 push it burst to
about 60 a minute for 40 minutes, fetching that push’s commits among old
ones.
It ignored the commits of a push made during the burst (11:56), and
of every later push before Anubis.
It had burst like this seven other times between Sep 27 and Oct 3,
four of them about five days after any push.
Three other episodes: single browser-like visitors who arrived
through links inside the forge.
What the evidence supports. On the ladder in § 11,
it reaches one temporal coincidence: one crawler burst, once.
It does not show a prompt response to publication, preferential
fetching of new commits, or repeated monitoring.
For the dominant cohort, “fired on each commit” did not happen in
these logs. That does not exclude polling that never fetched commits,
long or infrequent reactions, other user agents, or activity on another
host.
None of this identifies who operates any crawler or why it
crawls.
The author asked whether a scraper was “monitoring for new commits
and specifically firing on each of them”.
Planned.analysis-plan.json was
recorded before any request series was aligned with pushes. It is
unchanged.
Amended.amendments.json (A1–A11) was
written in this thread at 22:35 and 22:58 UTC on Oct 19, before
alignment. It fixes undefined or unexecutable parts of the plan (§ 2–4)
and adds robustness designs.
Exploratory. The hash-level analysis was added as
A10(c) before alignment. The source-level checks, endpoint splits, the
declared-crawler burst scan, the GitHub-preceded subset beyond its A5
definition, and the daily association were all chosen after seeing
results.
Labels below follow this division. Raw logs, addresses, user agents,
queries and request sequences stayed on the VPS. Only aggregates are
here.
2. Publication: what
became visible, and when
Source: data/publication-snapshot.json, a fresh
read-only collection at 2026-10-19 22:23:19Z. It holds all 345 commit
objects in the store, reflogs, refs, Forgejo action and branch rows, and
no messages, names or emails. Reconstruction:
source/reconstruct_publication.py →
data/publication-episodes.csv,
data/commit-publication.csv and
data/publication-audit.json.
History rewrite, and no left censoring. The current
graph has a single root commit, committed 2026-08-29 15:25:51Z.
The rewrite. At 16:40:34Z that day a force-push
replaced the old history (notification 199: three commits ending at
49d6d24).
No censoring. That notification dates the old tip
of the first retained reflog (17:40:11Z). Every current commit therefore
has a reconstructible first Forgejo publication, and the provisional
snapshot’s left-censoring problem disappears.
Old hashes. 90 of 92 earlier push notifications
name objects that no longer exist.
Known removed hashes. 6,615 GETs named hashes
listed in those notifications; 4,960 returned 404 and 1,619 returned
403.
Unresolved. 2,873 GETs named hashes that match
neither the current graph nor that list; 2,132 returned 404 and 718
returned 403. They have not been shown to belong to the removed
history.
Combined: 9,488 GETs, of which 7,092 returned 404
and 2,337 returned 403.
Units. A publication episode is the set of ref
transactions in the same second.
Inventory, Oct 1–13. There were 48 episodes (5 of
them on Oct 4) and 271 previously unpublished (“novel”) commits.
Every episode exposed something new. Each one
exposed at least one novel commit, so “ref updated” and “novel exposure”
coincide in this window. They are kept as separate fields.
Item
Finding
Reflog vs notifications
Every retained branch update (82 since Aug 29; 49 in October)
matches a notification within 30 s; lag 0–20 s (median 2 s); no reflog
update lacks one
Oct 1 12:27:01
One episode: main plus two newly created branches, 14
novel commits
upgrade-check
Created, pushed and deleted within one notification second,
2026-10-01 19:49:36; transaction in [19:49:16, 19:49:36], minute
certain
upgrade-check content
Notification Len 10 is a recent-commit cap. It exposed
2 novel commits, which main later carried at 21:11:07 (that
push’s Len 7 includes them; novel count 5)
upgrade-check context
Post-upgrade verification push after the Forgejo 1.21 → 15.0.9 chain
(19:24–19:45)
Tags, releases, mirrors
None for this repository
Commits never published
None
GitHub precedence
origin pushes to Forgejo then GitHub; GitHub events
trail Forgejo by 2–4 s for every Forgejo push
GitHub-only pushes
Nine GitHub-only pushes (Oct 6 17:19 to Oct 10 10:24) put the novel
commits of 7 Forgejo episodes (E071–E076, E080) on GitHub 4.5 min to
17.6 h before Forgejo
Requests before publication
No request named a current commit before its first Forgejo
publication. No reconstruction error, no earlier visibility
Commit-creation times were never used as publication times.
3. Measurement, coverage
and verification
Aggregation.source/aggregate_requests.py ran read-only on the VPS over
the private archive, 2026-09-27 00:00 to 2026-10-19 22:00. That covers
16 archives: 2,135,701 legacy lines and 1,384,453 forge JSON lines.
Malformed lines: 13.
Duplicate request IDs: none.
Maintenance-probe requests excluded: 1,357.
Legacy overlap rule: legacy records at or after the
first JSON second (2026-10-03 22:42:55) were dropped. One record was
affected.
source/build_tables.py produced the following:
data/minute-series.csv.gz. A dense
table with one row per minute (33,000 rows). It carries coverage flags,
policy phase and log regime, and these columns:
cohort × status counts, endpoint splits, owner and internal-address
subsets;
start-time (completion − request_time) variants;
Git smart-protocol series, other-repository controls, and
non-repository forge routes (JSON era only).
data/hash-requests.csv.gz. Counts by
hash, path position, cohort, status, method, minute and flag.
Verification. Hourly requests, HTTP 200s and HTTP
403s were rebuilt with the existing parser’s definitions (scope =
repository, all methods, checks excluded). For all 312 hours of Oct 1–13
they match 2026-10-14/hourly-summary.csv exactly, for all
agents, the Linux/Chrome cohort and the Meta cohort. A re-run of the
aggregator, after refactoring the owner pass, reproduced every series
and hash row exactly.
Coverage (data/coverage.json):
Quiet runs. Ten-minute or longer runs with no
logged line appeared on Sep 27, Sep 28 02:12–02:38 and Oct 14
19:21–19:33.
Rotation gaps. There were three gaps of 60 seconds
or more, all after Oct 16.
Forgejo upgrade. Oct 1 19:20–19:50.
Archive-route switch. Web source-archive routes
moved from 200 to 404 at Oct 1 20:21. This was located from archive
statuses alone and padded ±10 min.
Other events. The Oct 3 22:42 log-regime minute and
the Oct 15 reboot.
None of these touches a push window except the upgrade and the
archive switch, which exclude E039 and E040. E057 crosses the log
cutover.
Owner and internal traffic. Six owner addresses were
identified privately, from successful pushes and authenticated
pages.
Pushes went over HTTPS on most days. No HTTPS push
was seen Oct 3–5.
Owner traffic is outside the cohort. No request
from those addresses falls in the Linux/Chrome cohort. Owner-flagged
successful GETs on the repository were few (38, mostly Oct 1–2, other
cohorts).
What the cohort looked like. The
linux-chrome-150-155 cohort is a user-agent heuristic (X11
Linux x86_64 with Chrome 150 or 155), not a verified identity.
Oct 1–5: it was almost absent from this repository,
with 0–40 successful GETs a day.
From Oct 6: it rose to 3,500–10,400 a day on Oct
9–14, and nearly all of it was commit-pinned file views
(src/commit, commits/commit,
blame, raw/commit).
Git fetches: smart-protocol fetches of this
repository by crawlers were essentially zero.
4. Planned primary test
Hypotheses.
H0: given the request series, the placement of each
occupied UTC hour’s publication episodes is uniform over its 60
rotations, independently across hours (no prompt response).
H1: more successful GETs after publication.
Statistic and null.
Statistic: T = mean over episodes of (count in
minutes +1…+30) − (count in −30…−1). The episode minute is omitted.
Outcome: successful (200) GETs of
website-repository web pages by the linux-chrome-150-155
cohort, excluding the Git protocol and probes.
Null: 10,000 random common circular shifts per
occupied date-hour block, seed 20261020.
p-value: (1 + #{T* ≥ T}) / 10,001.
Why the p-value is valid. Block rotations form a
group, so this p-value is valid under H0 (Hemerik & Goeman 2018;
Phipson & Smyth 2010).
Hours with one episode. This is exactly interval
jitter with 60-minute windows (Amarasingham et al. 2012).
Hours with several episodes. The rotation preserves
their spacing modulo 60, which is a larger, more conservative null.
What the test does not establish.
Not causation. It is not a randomized design, and
rejection would not identify a mechanism.
Clock-hour pushes. If pushes systematically fell at
particular minutes, the synthetic checks show false positives of 18–39%.
The observed episode minutes are spread over the hour (8, 12, 16 and 12
per quarter).
Eligibility (A6).
Rule. An hour block is usable only if [H − W, H +
60 + W) is fully covered, lies in one stable policy phase and one log
regime, and contains no recorded disruption.
Applied per block. Eligibility is a block property,
so it holds for every shifted placement.
Excluded episodes. The rule excludes Oct 4 (5
episodes), E039 (upgrade), E040 (archive switch) and E057 (log
cutover).
Result.
Quantity
Value
Episodes / hour blocks / overlap clusters
40 / 37 / 32
Raw T (mean post − pre)
4.25 requests per episode (829 after vs 659 before)
Null mean (exact expected raw difference over rotations)
1.89
Rotation-adjusted excess (T − null mean)
+2.36
95% interval for the adjusted excess, overlapping-window clusters
(32)
−1.47 to +7.75
95% interval for the adjusted excess, whole UTC dates (10)
−1.97 to +10.47 (few clusters; not a validated guarantee)
One-sided p
0.151
Episodes with zero in both windows
28 of 40 (the cohort was absent before Oct 6)
Plan-literal, each ref update a batch
T = 4.10, p = 0.146 (42 batches)
Leave one date out
p from 0.072 (without Oct 10) to 0.712 (without Oct 13: raw
+0.55, adjusted −0.49)
Cohort-active dates only (Oct 6–13; post-review)
15 episodes, 6 dates: raw +11.2, adjusted +6.27, p = 0.153
Oct 13 is the only influential day (figure). Its two
episodes (E081, E082, one commit each) sit inside the Oct 13 daily
ramp.
No new targets. Hash-level data show none of the
cohort’s requests in those windows targeted the new commits (§ 6).
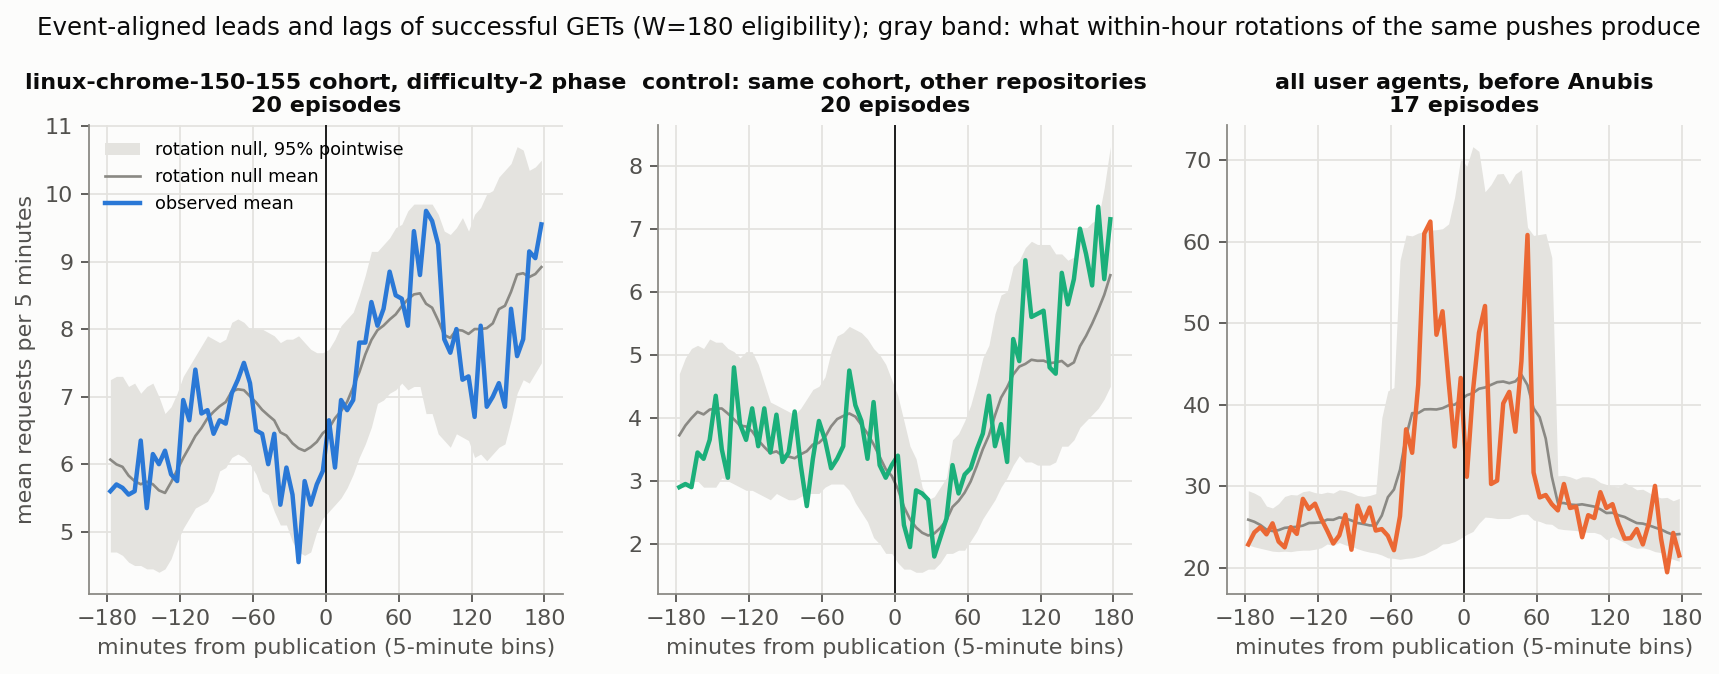
The rise is shared. In the lead/lag figure, the
cohort’s rising level around pushes tracks the rotation-null mean. The
same cohort shows the same shape on the other
repositories.
5. Planned
sensitivities and amended analyses
Planned sensitivity rows are as recorded. Amended rows are A5–A11.
All tests are one-sided against an increase. Only the window family is
multiplicity-adjusted. Values are raw T, with the rotation-adjusted
excess in parentheses.
Analysis
Episodes
Raw T (adjusted excess)
p
Planned: isolated (no other episode within 60
min)
26
6.31 (3.49)
0.158
Planned: all user agents, 200
40
−16.25 (−23.06)
0.769
Planned: cohort, all statuses (GET)
40
9.50 (5.29)
0.115
Planned: other repositories, cohort 200 (negative
control)
40
−2.85 (0.24)
0.448
Planned: phase before Anubis, cohort
20
0.10 (2 vs 4 requests in total)
0.485 (no data)
Planned: phase before Anubis, all agents
20
−41.2 (−51.1)
0.796
Planned: phase difficulty 2, cohort
20
8.40 (4.71)
0.151
Planned: window 5 min
41
0.32 (0.27)
0.238 (Holm 0.476)
Planned: window 60 min
39
10.97 (4.88)
0.110 (Holm 0.329)
Planned: window 180 min
37
35.27 (1.91)
0.337 (Holm 0.476)
Amended: owner and internal addresses removed
40
identical to primary
0.151
Amended: GitHub-preceded episodes removed
33
4.85 (3.97)
0.048 nominal; without Oct 13, 0.36 (0.58), p 0.37
Amended: start time instead of completion (JSON
era)
Amended (post-review): requests per novel commit, Σ
Dᵢ / Σ nᵢ over 235 commits
40
0.72 (0.40)
0.151 (a rescaling of the primary statistic, not an independent
result)
Amended: time-of-day referents (same clock minutes
on other eligible days of the phase)
40
4.25 (3.21)
0.141
Amended: time-of-day referents, all agents
40
−16.25 (−13.33)
0.887
The single nominal p below 0.05 (GitHub-preceded removed) is one of
about 20 tests in the table. It disappears without Oct 13.
Exploratory endpoint and route splits
(results/timing-results.json, exploratory;
same design, unadjusted, not confirmatory):
Cohort endpoints. Commit views, branch views, root,
feeds, raw, blame and history showed nothing (all p ≥ 0.10). Branch
views and the repository root carried 0 to 5 requests in total.
Other routes. The Git protocol,
/explore, the user profile and feed, and the repository API
were near zero, and the forge root was flat.
6. What was fetched
source/hash_analysis.py covers GETs naming a commit in a
semantic path position (src/commit/<sha>,
commit/<sha>[.diff|.patch],
commits|raw|media|blame|rss/commit/<sha>,
archive/<sha>.*,
compare/<a>...<b> and the repository API).
Hash resolution. Abbreviated hashes were resolved
uniquely against the graph and the deleted-history list. No ambiguous
prefixes occurred.
HEAD requests. A declared crawler paired every GET
with a HEAD. The 3,067 HEAD requests are excluded.
Cohort linux-chrome-150-155
All agents
GETs naming a current commit
90,122
206,993
…target under 1 h old
0
—
…1–6 h / 6–24 h / 1–3 d / 3–7 d / over 7 d
36 / 568 / 57 / 2,191 / 87,270
—
Requests per available commit-hour, under 1 h → over 7 d
0 · 0.07 · 0.28 · 0.01 · 0.12 · 2.00
—
Share of 271 study commits fetched by 1 h (Kaplan–Meier)
0%
5.2%
…by 6 h / 24 h / 7 d
0.7% / 1.5% / 13.7%
7.8% / 22.9% / 51.3%
Commits ever fetched by Oct 19 22:00
120
140
Study episodes with any fetch within 1 h
0 of 48
4 of 48 (E035, E053, E058, E063); 3 of 43 without the Oct 4
deployment day
Youngest target, age at the start of the request minute
1.35 h
—
Ages use the request-minute midpoint (completion times, minute
resolution). At the start of the request minute, 87,265 of the cohort’s
requests are definitely older than 7 days (87,270 by midpoint).
A monitor would sit on the diagonal. It would place
points just above the “just published” line.
The cohort forms horizontal bands instead. They sit
at commits published Aug 29 to Oct 3, requested from Oct 6 onward. That
is consistent with a list of URLs gathered by about Oct 3 and worked
through slowly. The logs cannot show how the list was built.
Declared crawlers. They crawled steadily until Oct
4, when Anubis denied or challenged them, then stopped.
Other user agents (no crawler token in the user
agent). Most of their young-commit requests are an Oct 5 wave that
re-traversed commits 1 to 7 days old.
Per-episode first-fetch lags are in
results/first-fetch-by-episode.csv.
Commits up to E053 (Oct 3 18:58). The cohort
fetched all of them, but first after 78 to 253 hours.
Commits from E054 to E075 and from E080 to E082.
The cohort never fetched them.
E076–E079. It fetched only the tip commit of each,
1.3 to 7.3 hours after publication (*_tip_first_lag_h),
then expanded each tip’s files over the next day. E079’s tip (Oct 9
20:53) is the newest commit it ever requested.
How the tips were found. The cohort requested branch
views (src/branch, commits/branch and
raw/branch for main, which display the current
tip) 218 times on Oct 9. On every other day it made 0 to 6 such
requests.
Timing. The tip fetches began while that
branch-view crawl was under way.
Afterwards. Branch-view requests then stopped, and
later tips were never fetched, even though the cohort’s traffic peaked
Oct 10–14.
This timing is consistent with link traversal that happened to pass
through the branch page. It is hard to reconcile with a monitor that
fetches each push’s commits promptly. The logs cannot identify the
mechanism uniquely, and polling that did not name commits would leave no
trace in this analysis.
7.
Sources of the fast fetches (private analysis, aggregates only)
Source: source/private_sources.py, run by
source/run_private_sources.sh. Output reduced by
source/summarize_private_sources.py to
results/young-fetch-sources.json. “Sources” are addresses;
rotating addresses need not be distinct operators.
Within 60 minutes of publication. 107 GETs from 10
addresses, in 4 episodes; none had an owner signal.
E035 (Oct 1). 90 requests from 7 addresses whose
user agent declares a crawler token (“shapbot”, a claim).
A burst on top of an ongoing crawl. Declared
crawlers had been fetching about 9 to 10 pages a minute from this
repository all morning. From 11:40 to 12:20 they burst to 19 to 64 a
minute, then fell back.
New addresses. Most of the addresses doing it were
new to the repository after the push. In the same minutes they fetched
the push’s 8 commits alongside many old commits.
They ignored the next push. E036 (11:56) was pushed
during the burst, and none of its 6 commits was ever fetched by a
declared crawler. The same holds for the pushes after it before Anubis,
except 2 of E037’s 14 commits, 13 days later.
Other bursts had no push nearby. Over Sep 27 to Oct
3 declared-crawler rates exceeded three times their typical level 8
times (results/declared-crawler-bursts.json, exploratory).
This one was the largest and the only one starting within an hour of a
push. Four started about five days after any push.
One coincidence, not repetition. This is the single
most response-like event in the data. A crawl refresh that grabbed a
commit list containing the newest push fits it as well as a trigger
does.
E033 and E034 (Sep 29, Sep 30; before the study
window). Fetches 1.3 to 5 hours later came mainly from
browser-like Chrome/Android user agents already crawling the repository,
plus single Googlebot-declared requests.
E053, E058, E063. One browser-like address each
(Chrome/Android, Safari/macOS, Firefox/Linux), arriving through links
within the forge.
They made 1 to 12 requests, 6 to 11 minutes after a push, mostly to
the tip commit.
This looks like a person following links. The owner checking their
own push is plausible but not established, because these addresses carry
no owner signal.
The cohort’s young fetches (E076–E079). 604 requests
from 265 addresses.
Mostly new addresses. 248 addresses were new to the
repository at that moment.
A few requests each. The median was 4 repository
requests per address in the whole study, with a maximum of 15.
The Anubis pattern. Each typically got a 403
challenge, with no referrer, then a 200 whose referrer was the forge
(the post-challenge redirect).
Only tip commits. No request reached an older
commit of those pushes.
8. Alternative explanations
checked
Author browsing after a push.
Owner-flagged traffic is outside the cohort, and removing it changes
nothing.
Unflagged browser-like visits within minutes of three pushes are
possibly the author. They are excluded from nothing, and they are too
small to matter.
Deploy and sync jobs.
make deploy pushes over HTTPS and rsyncs the site over
SSH. Neither shows in the web outcome.
The 15-minute reconciliation job (from Oct 16) uses SSH on the
loopback interface and postdates every push.
Maintenance probes are excluded by user agent: 1,357 requests.
The time-of-day and daily ramp.
Rotation and time-of-day referent nulls both absorb it.
The same shape appears on the cohort’s other repositories.
Website publication rather than repository
monitoring. Each main push is also a website
deploy. A crawler watching the website could follow its footer link to
the repository root, but the cohort’s successful repository-root
requests were zero over the whole study.
Feeds, /explore, the user page and the
API. All were near zero in push windows.
Discovery through GitHub. No request named a commit
before Forgejo had it, even when GitHub had the commit up to 17.6 hours
earlier.
Policy and logging breaks. Episodes are excluded by
rules fixed in advance, and the results hold with and without the
relaxed variants.
Correlation across days. The daily Spearman
correlation between pushes and the cohort’s traffic is −0.85
(results/daily-association.json). This is descriptive and
confounded: pushes clustered Oct 1–5, before the cohort arrived.
9. Power, robustness
and what the null can say
source/power.py: placebo push trains are drawn from the
rotation null, a response is planted into the real cohort series in
minutes +1…+10, and the planned test is re-run 300 times per size.
What the simulation measures. It is conditional on
its injection model.
Volume, not behavior. It measures added request
volume. It says nothing about hash-specific behavior, and it covers only
this one way a monitor could act.
Every push gets a response. The headline rows add a
response after every eligible push, including days when the cohort was
nearly absent. Those zero-background episodes make detection easy.
Per-commit sizes are expected counts. “Per novel
commit” means an expected number of requests per commit (Poisson), not
exactly that many for each new hash.
No inferential bound from the zero counts. The
cohort fetched nothing within an hour in all 48 study episodes, 43 of
them outside the Anubis deployment day.
results/power.json keeps zero-event binomial figures:
6.7% for 43 episodes and 18% for the 15 cohort-active ones.
Those figures assume independent opportunities with one common
probability. Clustered pushes, crawler campaigns, and dates when the
cohort was absent do not meet that assumption, so they are an
illustration, not a bound on monitoring.
What a null p does not prove. Monitoring by a
small, quiet actor outside these cohorts cannot be excluded from p >
0.05. Nor can a reaction slower than 3 hours that leaves no age
signature.
Where the strongest constraint comes from. The age
distribution and the never-fetched commits. The timing test adds
less.
Exactness. Under a constructed null with requests
held fixed, the rejection rate was 3.3% at α = 0.05.
A realistic null. Bursty, day-trending series with
a :00-minute cron, and random push minutes, gave 4.5%.
Power. A planted response gave power that rises
with its size.
Failure mode. Pushes fixed at :58 gave 18% false
positives, or 39% with a :00 cron. The observed push minutes do not show
that pattern.
Mechanics. Unit tests cover window indexing,
rotation, block eligibility, Holm, Kaplan–Meier and clustering.
10. Limitations
The cohort and the clock barely overlap. Before Oct
6 the cohort was absent from this repository; after Oct 13 there were no
pushes.
So the informative timing data are about 15 episodes on 6 days.
Later quiet days are background, not new treated observations.
Cohorts are user-agent claims. Address counts are
not operator counts. Network and user-agent labels do not identify an
operator or its purpose. Nothing here bears on AI training.
Policy changes muddy the outcome. Anubis changed
who could fetch at all:
a 403 challenge is a fetch attempt;
in the difficulty-2 phase, successful GETs measure solved
challenges;
declared crawlers were denied or challenged from Oct 4.
Completion times are second-resolution before Oct 14.
The start-time variant is JSON-era only.
GitHub is outside the logs. Its events API covers
only about the last 30 days, and nothing here observes requests to
GitHub.
The owner flag is incomplete. There were no
HTTPS-push signals Oct 3–5, so flagging relies on the adjacent-day
rule.
The dependence model is unverified. The intervals
resample 32 window-overlap clusters or 10 dates. Pushes in separate
windows can still share a crawler campaign or a day’s activity, and the
two schemes give noticeably different widths.
Within-hour exchangeability is assumed, not
demonstrated. The synthetic checks validate the mechanics under
simulated nulls. They do not show that the real publication schedule is
exchangeable within hours.
Ages are minute-resolution. Hash ages use the
request-minute midpoint.
11. Conclusion on the
evidence ladder
Rung
Supported?
Temporal association between pushes and requests
Not detected (p = 0.15, driven by one day). One declared-crawler
burst 20 minutes after one push (Oct 1), and three single browser-like
visits
Prompt response to publication
Not observed: 0 of 48 episodes for the dominant cohort within 1 h.
The Oct 1 burst is a single occurrence, ignored the next push, and
resembles bursts that had no push nearby
Preferential fetching of novel commits
Not observed: the cohort requested old commits about 7 times as
often per available commit-hour (over 7 d vs 6–24 h), and never reached
most new ones
Repeated monitoring behavior
Not observed: no actor repeatedly fetched new commits soon after
pushes. Intermittent monitoring, polling that never named commits, and
activity outside these logs remain unresolved
Identity or intent of any operator
Not addressed by these data
12. A prospective design, if
wanted
The historical data cannot test a monitor that would fire only when a
crawler is active. For a clean test:
Fix the outcome and logging plan first. Keep the
current JSON logs, add the time_unix and referer fields
already present, and use this aggregator unchanged.
Publish separated pushes. Make 20 to 30 small
pushes, each exposing one new-content commit.
Space them at least 3 hours apart, at randomized times drawn in
advance, over 2 to 3 weeks.
Include quiet control days.
Keep everything else constant. Make no
make deploy coupling: push without deploying, so
website-change and repository-change effects separate. Keep Anubis
constant throughout.
Choose the primary outcome. Use first GET naming
each new commit, by cohort, within 1 hour. Use the randomized schedule
as the null.
This requires creating artificial commits, which was not done here
and needs the author’s go-ahead.
13. Revisions after review
(2026-10-20)
An independent spot-check (SPOT-CHECK.txt) reproduced
the primary p, the window sums and the 90,122 count, and found the
following. Every fix was re-run from the frozen tables; the primary null
file is bit-identical.
Conclusion. It now reads as observed behavior: no
convincing evidence of repeated prompt fetching. It no longer excludes
monitoring in general, and the mechanism language is softened from
“link-following, not a trigger” to “consistent with link
traversal”.
Estimands. The summary had mixed the adjusted
excess (+2.36) with the raw leave-one-out mean (+0.55). Raw and adjusted
are now reported side by side throughout, including without Oct 13 (raw
+0.55, adjusted −0.49).
Detection simulation.
“100% detection” is now “300/300 under the all-push injection
model”.
The difficulty-2 (68%) and new cohort-active-only (52%) results for
+10 requests are added.
Binomial bounds. They are now presented as
illustrations under an independence model, and renamed in
results/power.json. The episode denominators are now
computed from the data, with the Oct 4 exclusion named.
“Per novel commit” row.
The old row was a batch-size-weighted episode mean; it is
relabeled.
The true aggregate, Σ Dᵢ / Σ nᵢ, is added: raw +0.72, adjusted
+0.40. It is a rescaling of the primary statistic, with the same p.
Removed history. Known removed hashes (6,615 GETs,
4,960 returned 404) and unresolved hashes (2,873 GETs, 2,132 returned
404) are now separate. Combined, 7,092 of 9,488 returned 404 and 2,337
returned 403.
Dependence. A whole-date cluster bootstrap is
added: −1.97 to +10.47 for the adjusted excess.
Minor.
Hash ages are labelled as minute-midpoint, with the minute-start
youngest age (1.35 h) and the over-7-day count (87,265) added.
The null-histogram figure no longer draws a leave-one-date-out
statistic against the full-sample null.
One error of my own is fixed: E058 falls on the Anubis deployment
day, so fast fetches occurred in 3 of 43 episodes outside that day, not
4 of 43.
14. Reproduction
Frozen inputs.
Publication snapshot: 2026-10-19T22:23:19Z.
Request window: [2026-09-27T00:00Z,
2026-10-19T22:00Z). The study window starts 2026-10-01; the planned
endpoint 2026-10-20T00:00Z was not yet observed (A1).
GitHub events: fetched 2026-10-19 ~22:26Z.
Archive identities:data/aggregation-meta.json lists them
(raw_sha256 and compressed SHA-256 at read).
The aggregate holds no addresses, but it is not
reviewed.PRIVATE/aggregate.json carries
per-minute counts and hash rows only. Keep it out of the repository
anyway; the reviewed tables are its reduction.
The snapshot is current state. Re-collecting the
publication snapshot later reflects any newer pushes.
Archives can change. The archive for the live day
is rewritten hourly until it rotates.
Reruns reproduce exactly.results/
numbers reproduce exactly from data/.
Files.
Inputs kept unchanged:HANDOFF.txt,
analysis-plan.json, and the provisional snapshot and
collector.
Review:SPOT-CHECK.txt (independent
spot-check; corrections in § 13).
Design and methods:amendments.json,
methods-notes.md (a methods read with quotes).
Data and results:data/ (reviewed
inputs) and results/ (outputs and figures).
Hashes:MANIFEST.sha256 covers every
file here.
Methods sources
Amarasingham A, Harrison MT, Hatsopoulos NG, Geman S. Conditional
modeling and the jitter method of spike resampling. J
Neurophysiol 107(2):517–531 (2012). doi:10.1152/jn.00633.2011;
supplement arXiv:1111.4296.
Hemerik J, Goeman J. Exact testing with random permutations.
TEST 27:811–825 (2018).
Phipson B, Smyth GK. Permutation p-values should never be zero.
Stat Appl Genet Mol Biol 9(1), Art. 39 (2010).
doi:10.2202/1544-6115.1585.
Mittleman MA, Mostofsky E. Exchangeability in the case-crossover
design. Int J Epidemiol 43(5):1645–1655 (2014).
doi:10.1093/ije/dyu081. This source supports the time-of-day referent
design and its caution against treating several outcomes of one exposure
as independent.
Harris KD. A shift test for independence in generic time series.
arXiv:2012.06862 (2020). Read for the failure modes of circular
shifts.